
.png)

StreetWise: A civic tech tool helping stormwater crews shift from
reactive cleanup to early prevention
A predictive flood-response platform designed for the City of Savannah's stormwater crews. By integrating real-time sensor data, resident reports, and drainage conditions into one tool, StreetWise helps crews prevent flooding before it reaches residents' streets — projected to shift the city from 80% reactive to over 50% proactive flood response.
My Role
Product Designer | UX Researcher | Design Strategist
Owned strategy, mixed-method research, concept design, prototyping, testing
and pilot validation
Skills
UX Research
Service Design
UX Design
Participatory Design Prototype Development
The Team
Lead Designer (me)
Project Director
Project Manager
Data Analyst
Tools & Methods
Interviews, Usability studies, Contextual inquire, Surveys,
Co-creation Workshops, Journey Mapping, Affinity Mapping, Thematic Analysis, Prototyping,
Miro, Figma
Timeline
14 weeks
PROJECT OVERVIEW
Savannah is a rapidly growing coastal city where aging infrastructure, unpredictable weather, and limited crew capacity have created a cycle of reactive flood response. Stormwater crews manage over 147 miles of ditches, 416 miles of pipes, and 14,700+ drainage inlets, yet data about flooding risks lives in disconnected systems, making it nearly impossible to act before problems escalate.
This project emerged from a broader city initiative exploring neighborhood resilience. Through extensive community research, urban flooding surfaced as the most urgent, actionable challenge. StreetWise is a predictive flood-response tool designed to integrate real-time sensor data, resident 311 reports, and known drainage vulnerabilities into a unified platform—enabling crews to prioritize interventions before streets flood, not after.
THE CHALLENGE
How might we help city crews with limited capacity shift from reactive emergency response to proactive flood prevention—when the data they need exists in fragmented systems they can't access in real time?
Constraints:
-
Resource scarcity: Only 3 vacuum trucks serve the entire city; ditch maintenance crews expanding from 1 to 5 in 2026
-
Data fragmentation: Rainfall sensors, 311 resident reports, and drainage condition data live in separate, non-integrated systems
-
Reactive workflows: Current processes respond after flooding occurs, leading to costly dredging and repeated cleanups
-
Trust erosion: Residents report issues but rarely see visible action, creating frustration and declining participation
REFRAMING THE PROBLEM
Original Brief
The initial project scope was broad—exploring how Savannah could build "thriving and resilient neighborhoods" amid rapid growth, with flooding as one of several environmental challenges alongside extreme heat and air quality.
What Research Revealed
Through 30+ interviews, 40+ community events, and 1,500+ survey responses, a sharper picture emerged. Urban Flooding wasn't just an infrastructure problem—it was a coordination and information problem. Data existed, but it wasn't connected. Crews were capable, but they were always reacting. Residents wanted to help, but felt unheard.
"We are 100% reactive. We'll get a request, or if it's special enough, we'll get a request via email from our city manager's office, and then we'll direct resources that way." — Stormwater Management Supervisor
The Reframe
The problem shifted from "How do we prevent flooding?" to
"How might we design a system that gives crews the right information, at the right time, to act before flooding happens—while rebuilding trust with residents through visible, responsive action?"
PROJECT OUTCOME
What we delivered
A validated product concept for Streetwise-backed by data, user research, journey maps and
service blueprint that maps the full end-to-end experience.

THE PRODUCT
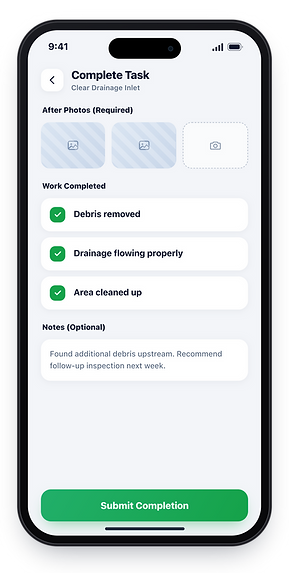
StreetWise — a single mobile tool that turns scattered data into a daily plan for stormwater crews.
The validated concept includes a daily dashboard, an on-site inspection flow, and a pre-storm coordination mode — each designed around how crews actually work in the field.
2
Daily dashboard — risk overview & priorities at shift start
1
On-site inspection — geofenced site detail with action
steps
Pre-storm coordination — live monitoring as a storm approaches
3
Seven Deliverables
-
STRATEGY & RESEARCH
Validated concept
Integrated predictive flood-response
platform
01
3 user journey maps
Crews, city leadership, and
residents
02
Design principles
Guide for future development
03
-
DESIGN ARTIFACTS
Interactive wireframes
Low-fidelity crew dashboard
04
Service blueprint
End-to-end system mapping
05
Storyboards
Crew & resident scenarios illustrated
06
-
VALIDATION
Prototype testing plan
Key assumptions, validation methods, and success criteria for the next phase and long term plan
07
-
APP SCREENS


.png)




.png)

.png)
Streetwise Journey map
PROJECTED IMPACT
By the numbers
A predictive system that shifts Savannah's stormwater operations from emergency
response to early prevention.
100% 50%
Reactive to proactive flood
response
25 - 40%
Faster crew deployment to
high-risk areas
5 1
Disconnected data systems
unified into single platform
42,564
Vulnerable residents in areas
now better protected
$8 M
Annual stormwater budget
now prioritized by risk
Qualitative Impact
Aligned Leadership
Unified cross-department vision for proactive stormwater management
Closed Feedback Loop
Connected resident reports to visible action, rebuilding civic trust
Validated by Users
Concept tested with frontline crews—confirmed it matches real workflows
Ready for Scale
Design prepared for 5x crew expansion in 2026—proactive from day one
The problem we solved
Savannah's stormwater crews manage 147 miles of ditches, 416 miles of pipes, and 14,706 drainage
inlets—but critical data lived in silos. Crews were skilled yet trapped in emergency response.
147
MILES OF DITCHES
416
MILES OF PIPE
14, 706
MILES OF DITCHES
"We are 100% reactive. We get a service request through 311... and then we direct resources that way."
— Stormwater Operations Lead
"If all of that could be created in one dashboard—
a one-stop shop—that would be extremely helpful."
— Stormwater Operations Manager
What changed
100% reactive
Crews responding only after floods occurred
5 disconnected systems
Sensors, 311, GIS, weather, historic data- all siloed
Residents reports
No visible action, eroding public trust
BEFORE
50 % proactive
Predictive risk maps guides crews before flooding starts
1 unified platform
All data sources connected in a single mobile tool
Reports to visible actions
Residents feel follow-through, rebuilding trust
WITH STREETWISE
WHY IT MATTERS
The 2026 budget expands maintenance from 1 crew to 5.
StreetWise ensures they start proactive, not reactive.
For 42,564 residents in the top 10% of climate vulnerability—68% Black, 25% below
poverty—this isn't efficiency. It's equity.
DESIGN APPROACH
I approached this project through a participatory systems design lens recognizing that effective civic technology must be co-created with the people who use it and designed within the constraints of existing systems.
My philosophy: Great civic tech doesn't just digitize existing processes—it reimagines workflows around human needs and system realities. This meant spending significant time understanding how work actually gets done before proposing how it could be different.
Phase Sequence:
-
Immersion & Synthesis — Absorbing research from the broader initiative; identifying flooding as the focal opportunity
-
Research & Systems Mapping — Understanding users, journey maps, organizational structures, and workflow patterns
-
Participatory Ideation — Co-creating solutions with residents, crews, and city staff
-
Concept Development — Translating ideas into a coherent product vision
-
Prototype & Validate — Building testable artifacts to learn what works
This sequencing allowed me to move from broad understanding to focused execution while keeping community voices central throughout.
RESEARCH QUESTIONS
The research was guided by questions that moved from understanding to action:
Understanding the System:
-
How do stormwater crews currently prioritize their work, and what information do they rely on?
-
Where are the breakdowns in the current flood response process?
-
What data exists, where does it live, and how is it (or isn't it) connected?
Understanding Users:
-
What do crews need to feel confident making proactive decisions?
-
What prevents residents from reporting issues, and what would encourage them?
-
How do different stakeholders define "success" in flood management?
Testing Solutions:
-
Can multiple data systems be effectively integrated into a real-time platform?
-
Does access to predictive information change how crews prioritize tasks?
-
Does increased resident participation improve prediction accuracy over time?
RESEARCH & SYNTHESIS
Methods & Rationale
Semi-structured Interviews
& Contextual Enquiry
Surveys
Community Events & Workshops
Co-creation Session
Neighborhood Walks
METHOD
PURPOSE
SAMPLE
Deep understanding of experiences, workflows, and pain points
Quantifying priorities and perceptions
at scale
Broad engagement; surfacing diverse perspectives
Generating solutions with, not for, users
Observing physical conditions and hearing local knowledge in context
30+ residents and stakeholders
1,500+ responses
40+ events, 500+ residents
6 sessions, 50+ participants, 200+ ideas
4-6 walks in vulnerable areas


1:1 interviews with residents and city staff


Ideation and brainstorming workshops with residents and city staff

Miro Bord: Research + Analysis & Synthesis board

SYNTHESIS APPROACH
Affinity Mapping
Clustered interview and workshop data into themes, tensions, and opportunity areas using Miro.
Thematic Analysis
Identified recurring patterns across data sources:
-
The "cycle of reaction" theme emerged strongly
-
Trust and communication gaps were pervasive
-
Coordination failures between departments were systemic
Journey Mapping
Mapped current-state experiences for crews, residents, and city leadership to identify pain points and opportunities.
.png)
.png)


KEY INSIGHTS
Four patterns that shaped the design
Insights that emerged from interviews, neighborhood walks, and synthesis — each one pointed toward the same conclusion: the data, the people, and the capacity were all in place. What was missing was connection.
THE REACTION TRAP
Both the city and its neighborhoods are trapped in a cycle of reaction
01
Flooding has grown more frequent and severe, straining aging infrastructure. With only three vacuum trucks for the entire city, crews scramble from one emergency to the next — costly dredging, repeated cleanups, and constant flooding instead of prevention.
THE TRUST GAP
Residents report issues but see little
visible action
02
Reports lead to frustration and declining participation, which further limits the city's ability to identify problems early. Many residents are also unaware of existing programs and resources due to limited outreach.
THE DATA DIVIDE
Critical flooding data exists in systems that don't talk to each other.
03
Sensor data, 311 reports, drainage conditions, weather forecasts — all live in separate platforms. This fragmentation means crews can't see the full picture, and decisions are made with incomplete information.
CAPASITY, NOT CAPABILITY
Crews are skilled and motivated — just constrained by reactive workflows.
04
Limited resources don't leave time for prevention. But the 2026 budget expansion from 1 to 5 ditch/canal maintenance crews creates an opportunity to design new, proactive workflows from day one.
FRAMEWORKS & MODELS
Frameworks turn messy research into shared decisions.
Throughout the project, I built four frameworks to help residents, crews, engineers, and leadership make sense of the same information and agree on direction.
01 PRINCIPLES
Design Principles
Five principles derived from research to guide every design decision.
Actionable over Comprehensive
Show crews what to do, not everything that exists
Proactive over Reactive
Design for prevention, not just response
Visible over Invisible
Make system actions transparent to build trust
Integrated over Siloed
Connect data sources that currently don't talk
Human over Algorithmic
Support human judgement, don't replace it
02 ECOSYSTEM MAP
Data Integration Ecosystem Map
Six fragmented data sources flow through one integration layer and out to three user types — turning silos into a connected system.
INPUTS
Rainfall sensors
311 reports
GIS maps
Weather forecasts
Historic patterns
Drainage records
INTEGRATION
StreetWise
Unified data layer + decision support
OUTPUTS
Crew dashboard
Daily priorities, on-site detail
Leadership analytics
Citywide performance, ROI
Resident visibility
Report status, neighborhood impact
REFLECTIONS & LEARNINGS
What I'm taking with me
WHAT I LEARNED
"Civic tech isn't a technology problem."
It's a systems, trust, and change management problem. The most elegant interface fails if it doesn't fit how work actually gets done.
"Co-creation produces better solutions — not just more ethical ones."
Residents and frontline workers hold knowledge no dataset captures. Bringing them into the design process changes what gets built.
"Reframing unlocks what infrastructure alone can't."
The original brief was "prevent flooding." The real opportunity was "design for proactive action within existing constraints.
"Constraints create focus."
Three vacuum trucks. One ditch crew. These limits forced the project toward information design and workflow optimization — often more impactful than technology moonshots.
WHAT I'D DO DIFFERENTLY
"Resident experience as a north star."
Prioritizing crews was the right call considering the scope, but developing the resident-facing vision more in-depth — even as a future-state reference — would have strengthened the case.
"Measurement framework, sooner."
Defining success metrics earlier would have created clearer alignment and made it easier to demonstrate value to skeptical stakeholders.
"Field time, earlier."
I engaged crews in workshops and interviews, but ride-alongs during actual storm events would have sharpened the design earlier.